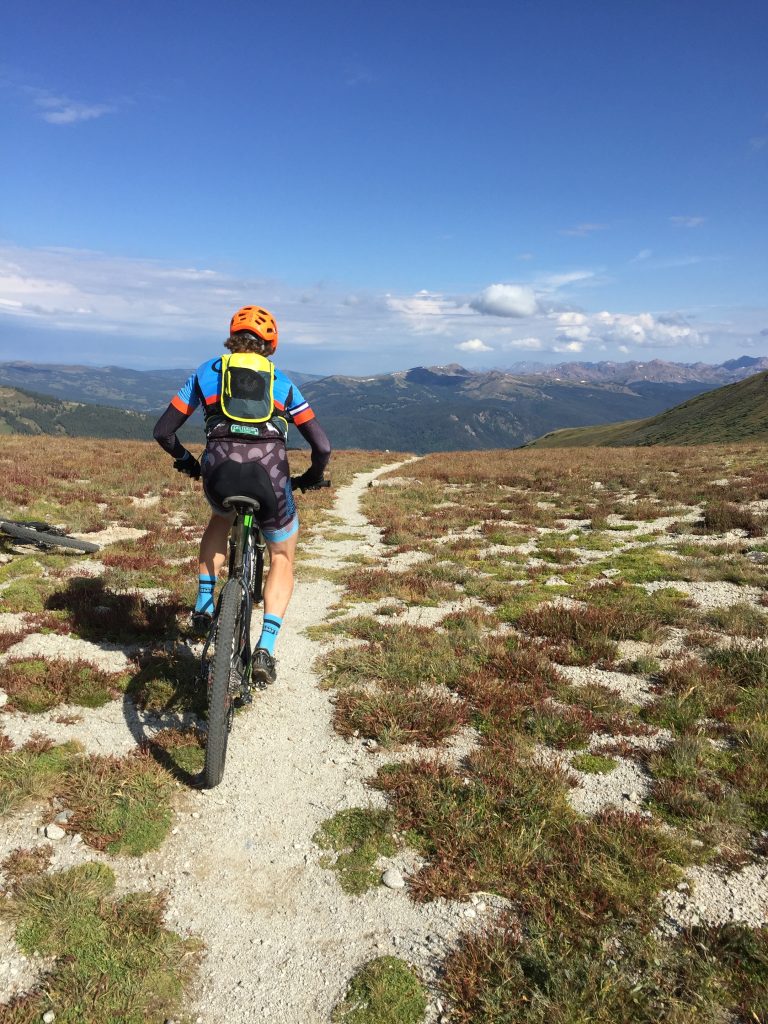
If you didn’t get a chance to check out the first two installments of tackling the Leadville 100 as a self-supported Time Trial, I suggest you backpedal and do so for the Part 1: Why and the Part 2: The Play by Play because this is about to get nerdy and laden with stats for those that want to geek out.
Let’s start with a snapshot of stats that went into the effort and then dig into what can be gleaned from it.
Duration 8:04 total ride time & 7:58:07 course time
Distance 106 miles (actual course is 104.4mi)
Avg speed 13.1mph
Elevation gain 11847ft
Avg power 195w (2.8w/kg)
Normalized Power (NP) 225w
Average Heart Rate(HR) 144bpm
Average cadence 81rpm (with 36rpms being lowest on Powerline inbound!)
Work expenditure 5734 kJs
Intensity Factor (IF) 0.75 **Ironic I guesstimated “Planned” IF as 0.75
Training Stress Score (TSS) 453
Variability Index (VI) 1.15
Average Temperature 61 degrees (with a low of 25 and peak of 86 for a 61 deg swing!!)
In coaching, data is only as good as the inputs. I review power duration curves daily and people hang their hats on them as you may know as you hear people spouting their FTPs, watt/kg power at VO2max, etc., but have they ever really completed a maximal effort for all durations on your power curve from sprint to endless hours? Most haven’t. I admit I’m culprit for rarely “testing” hardly any durations on my PD curve and let efforts from races, intensive training sessions, or hard group rides fill it in. It’s not always the most critical data and I don’t rely exclusively on the data nor my PD curve to inform fitness; I let performance or results speak for that. But let’s be honest most of us rarely get to perform so extensively, like that required by the Leadville course. Because of that simple fact, I set new bests for all durations exceeding 4 hours up to 7:49 (which ironically looks like a very small part of the PD curve below noted in red)! Not too shabby considering executed above 10,000 feet.
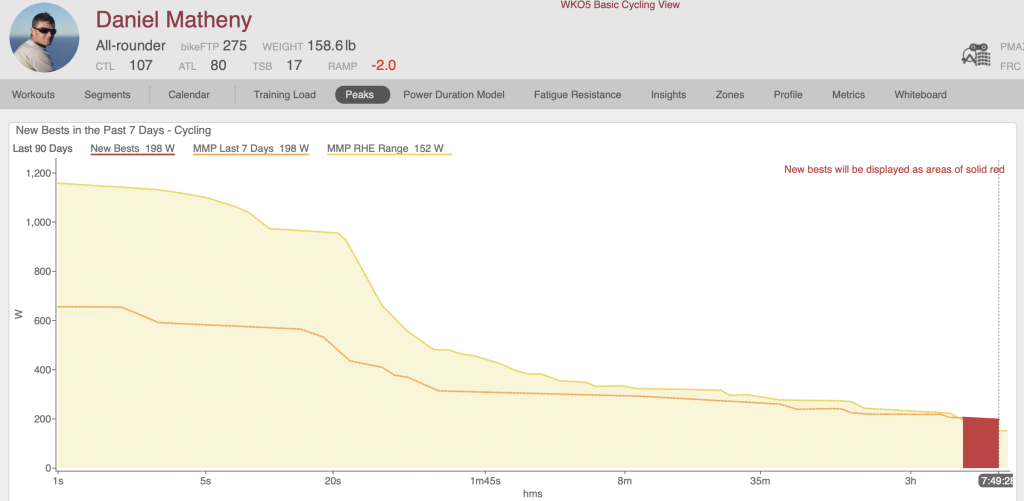
Power Duration Curve taken from WKO Analytics
It makes sense since I don’t typically get the opportunity to ride much longer than 3 ½ hours and very rarely on the gas that entire time. Do I think this is the most accurate data? For altitude, I’d say “Yes it’s accurate”; at least since performance informs the data. But drop to where I normally live at 6,200 ft and I’d expect it to be higher.
I must chuckle because I see and hear coaches and athletes referencing stats (all with mostly good intent) that can be done when what actually can be done is different. You never know how you can perform until you stay on the gas for that long. Trust me mustering Tempo power up the Boulevard past mile 100 was excruciatingly hard and the RPE way exceeded the output.
Interesting to point out in this visual above is that I didn’t touch anything close to my peaks below ~20min let alone new peaks (orange line versus yellow fill). This was an intentional part of the pacing as I mentioned keeping my bandwidth tight; purposely investing most of my energy where it mattered most. I’ll go deeper into this at a later point.
Next, let’s look at the Planned versus Actuals. After all these years of coaching, I find I get fairly close to “guesstimating” the completed IF in advance of their event based on what I’ve observed in training data. I must take a second to pat myself on the back for nailing this one on the nose. I’d planned a 0.75 IF and the resultant outcome was exactly that!
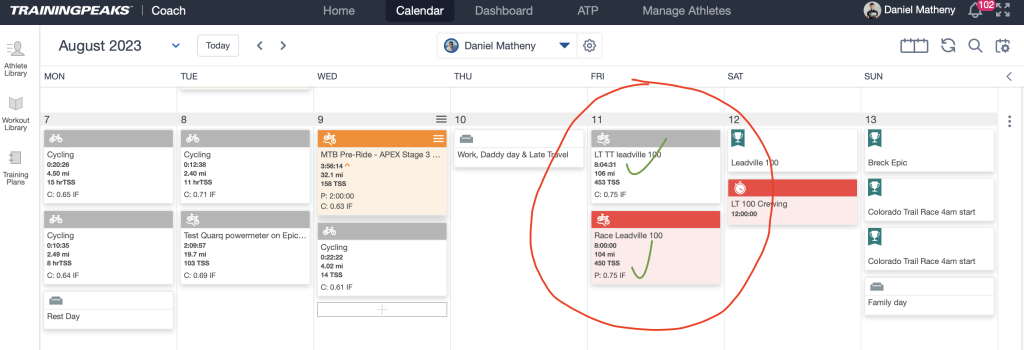
The reason I brought up Intensity Factor (IF) first is I was pointed by an athlete I coach to a podcast where Coach Jonathan of TrainerRoad mentioned pacing Leadville by IF and I thought the recommendations sounded conservative based on data I’ve observed. The recommendation as they explained was to first drop your FTP by 20% (adjusting for altitude) and then attempt to ride/pace at 0.70 IF to have the best race outcome. IF is a data point I added to a page on my headunit this past year. I reference it frequently during my training to better understand how different work and rest periods affect this stat to ultimately better communicate with athletes. I see this stat as somewhat of a “smoothed” response to the stress being placed on the body.
So what is IF or Intensity Factor? If you’re unfamiliar with IF, that’s A-OK, but it’s worth defining it and another few key metrics before we go on and TrainingPeaks has a full list of metrics defined here.
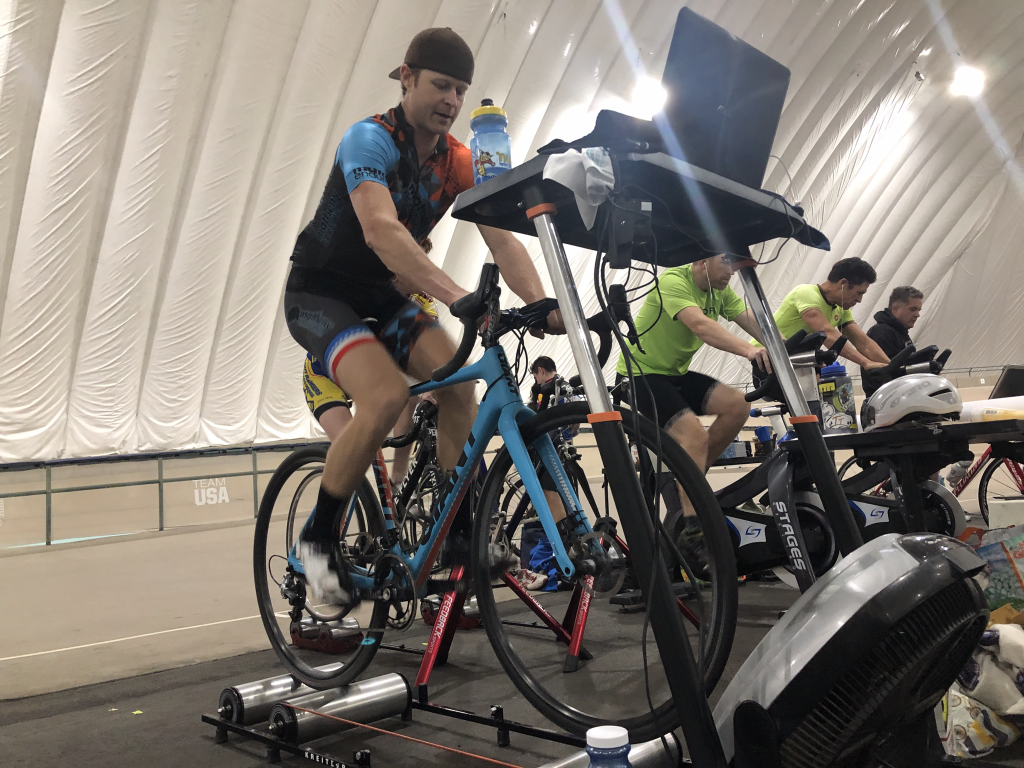
IF is an intensity ratio derived from NP (Normalized power) relative to FTP (Functional Threshold Power). Where NP is based on a rolling 30-second average and is “an adjusted power” taking out the dips. Since NP is often referred to as “how hard the effort felt to your body” or “the physiological cost of the effort” and thus plays into the calculation of IF; I think of IF as the percent of threshold maintained for a given workout or segment. An example is riding at FTP would result in an IF of 1.0 and an IF >1.0 would be representative of maximal aerobic power efforts. These stats change when you take into account the entire ride duration including rest periods often normalizing to more of 0.80-0.85 and 0.85-0.95 respectively for a workout. **Realize this is a rough estimate. Depending on how much endurance riding is completed as well as absolute efforts when not at those specific outputs referenced affects the ultimate end IF stat. Similar to average or normalized power, IF doesn’t fluctuate much once some duration is accumulated, which can offer aid in pacing longer efforts. Generally speaking, more spikey and stochastic efforts (like mountain biking, crits, etc.) usually produce a higher NP than the corresponding average power thus affecting the resultant IF. This is evidence seen in my overall average of 198w, while the NP of 225w is significantly higher. My body would agree with the NP data that it felt more like a 225w effort than a steady 198w. The latter isn’t as taxing to me, and I’m not just saying that without data because yes I’ve done a 24-hour fundraiser solo on rollers before!
Back to the pacing recommendation from the podcast; I kinda agree, but kinda disagree with this tactic. Since I’m also a fan of the Keegan Swenson concept of “altitude isn’t real” that would result in not adjusting for altitude, but I joke because altitude is real. Living in Colorado Springs where both the Olympic Training Center and Pikes Peak are located has allowed me and athletes I coach to take part in several altitude studies executing maximal exercise tests simulated at the top of Pikes Peak versus sea level and have seen the data. But I’ve also been lucky enough to have minimal effects at moderately high-altitude races. Even to the point of matching, if not exceeding, new best peak powers at altitude that I hadn’t seen in training at lower altitudes. I give credit to the extrinsic motivation of racing being greater than that of training. Chasing riders and wheels speaks louder to me than chasing watts on a device in training.
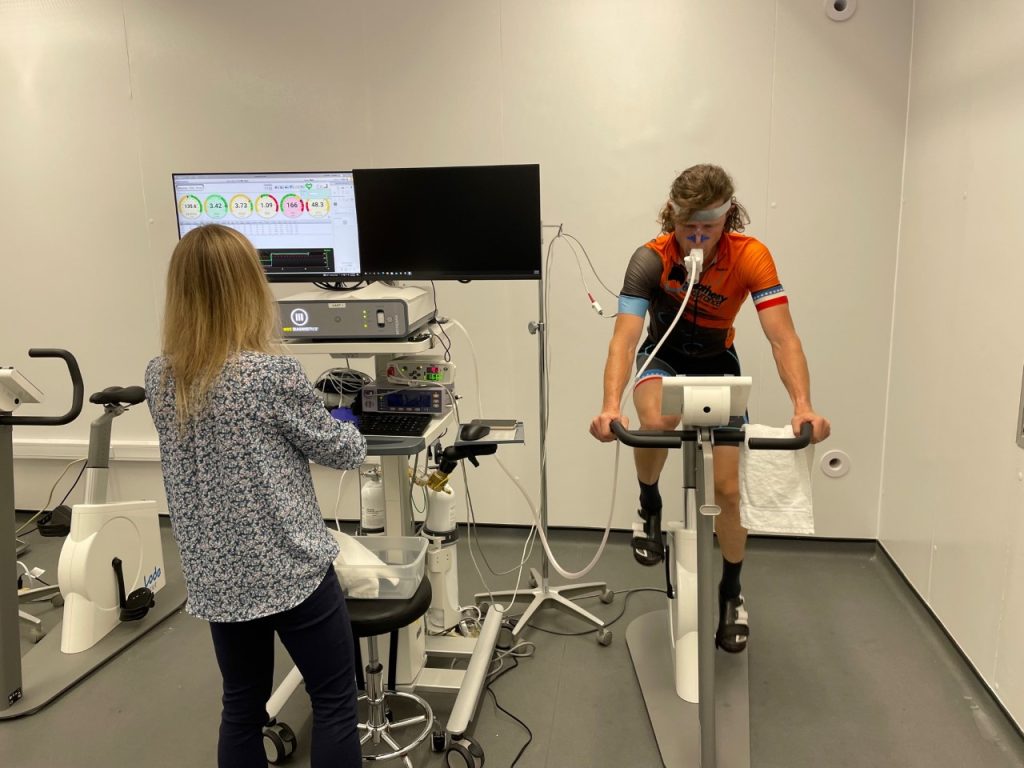
Bottom line, I thought reducing FTP by 20% AND aiming for 0.70 IF from that altitude-adjusted FTP was too low! This comes with a caveat of “At least for me based on past experience and data” since I’m acclimatized to altitude. I live at 6,200 ft often reaching 10,000 ft on some training rides, and from previous experience setting peak powers at Winter Park MTB Nationals that was all above 9k ft, but that wasn’t always the case. Whew doggie did I ever suffer when I first moved here from 400 foot elevation of the KY and TN region? I honestly thought I could hold 0.75 which kinda relates to a “no-mans land” effort that is high endurance/low tempo without any altitude adjustment. If I’d adjusted my FTP this actual would be inflated to 0.85!!! Don’t get me wrong, for riders coming from sea level maybe this is a good suggestion. Or I’d likely suggest a hybrid between the two approaches based on their mental fortitude, previous experience, athletic years, etc., because by no means is holding that output for the entire day easy.
Now that I’ve explained the rationale behind why I wanted to test pacing by stats like IF, I think the far more critical aspect is actually HOW to accomplish that pacing and ultimately IF stat by real-time execution. I’ve become a proficient racer over the years of training and racing and with that experience comes pacing. Possibly to the point it’s become 2nd nature to me. But the conversation I have with many athletes involved 2 concepts; 1) establishing a tighter range of output, aka a ceiling as well as a floor, and, 2) learning to “float” your RPE & heart rate given #1.
Establishing both a ceiling and floor is critical in my experience over aiming for an average power on the day. The ideal range for this case is primarily Endurance (Zone 2) up through Threshold (Zone 4). The ceiling ensures you don’t go into the red and write checks early you can’t cash later. This is based on the principle of intensity and duration being inversely related. Sure there are times when terrain or a move requires you to put in a dig at or above that ceiling, but the sustained duration of this dig and the ROI (return on investment) are important factors. Does it allow you to carry speed over a crest? Can you clear the next feature with a surge? Does the effort get you with a fast-moving group that aids in your overall goal on the day? Those questions matter.
Regarding the floor, this is often overlooked and is just as important, if not more so. Most people hear, “Don’t go too hard!”, but not “Keep pressure!” As I referred to in Part 2 on the Turquoise Lake Rd or even the Boulevard, it can look like giving yourself a carrot aim for when you’re tired. Or conversely, when the course doesn’t necessitate higher outputs it can keep you from dropping too low or even coasting. This keeps you on the gas even when you could become complacent. You don’t have to be hammering, but to conquer the day done, constant forward movement is the name of the game.
If you’re finding this valuable then please consider scheduling a consultation or donating Venmo @mathenyd or Paypal @Matheny.
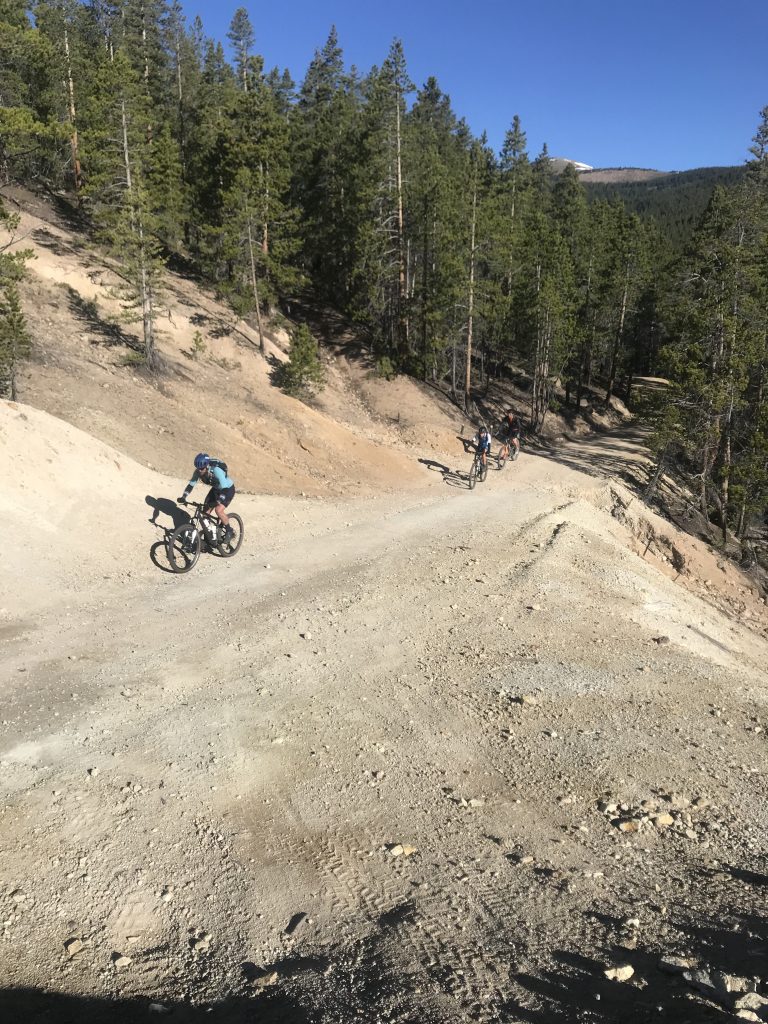
Now with an IF stat in mind to test AND a real-time output range to work within let’s see how I played out. I was using IF as reins to keep me in check. I know I likely can go out too hard and suffer later, especially with my lack of long volume in preceding training. I surprised myself early when I saw an IF of 0.89 up the 1st climb of St. Kevins. This translates to a Threshold effort in training and rightfully so a bit alarming. I didn’t want nor intend to push this hard since I was doing this as an intentionally paced effort, but it still fell within my execution guardrails. This leads me to the next part of my pacing plan that I alluded to in previous articles, the heart rate response and RPE.
If I was able to float my cardiac response within Endurance (Zone 2) and Tempo (Zone 3), and limit nearing my LTHR for only very brief periods while the RPE also aligned, then I’d press onward. I barely neared my LTHR and just at the end of the initial steepest pitch of St. Kevins, but overall was averaging mid-Tempo with a lower RPE, so I kept the pace going by feel.
Testing this “potentiation” of the physiological response too much can come back to bite you and why the whole premise of pacing exists. Because like when asking a signficant other and getting the response “it’s fine” and you know it’s gonna come back later as “not fine!” And yes I fell victim to this feeling later. Often when you’re fresh, peaked, fueled up, and the fatigue is void from the system at a key event, RPE is lower for a given effort. Thus allowing you to inadvertently overcook yourself from feeling too good!
More on that later, but for now, sticking to the IF trend. The start in St. Kevins Gulch consists mostly of climbing and dynamic terrain with steep and punchy efforts required. So I felt the IF stat was slightly inflated by the course demands. But also that stat is skewed because of my riding style of having an anaerobic/FRC capacity to punch above FTP and recover. That proved true as the subsequent climbs that are respectively more smooth pedaling efforts consisting of Turquoise Lake Rd, Hagerman Pass, and Sugarloaf summit produced a slightly lower IF of 0.83. And when you stretch that segment out even longer to Pipeline aid which then includes more downhills (uh hum Powerline!) it lowered even more to 0.76. This is because those times of coasting and descending lower the overall averages and stats like IF.
Honestly after a couple of hours in while chugging across the Pipeline section, I’d taken the edge off any freshness and settled in. I will share a public link to the effort where you can see each segment and stats, but for the sake of brevity, here is how IF unfolded segment by segment.
Pipeline to Twin Lake 0.76
Twin Lakes up Columbine 0.78
Columbine down Twin Lakes 0.60 (big descent and not a lot of time to pedal if you’re doing it right!)
Twin Lakes to Pipeline 0.70 (was suffering mentally into a headwind & a bit of gut discomfort here)
Pipeline to Powerline/Sugarloaf summit 0.73
Sugarloaf to Carter Summit 0.64
Carter to finish 0.69 **worth noting I’m pretty good descending so didn’t have to push on the downs but was able to hold 0.79 up the Boulevard.
Now with those segment-by-segment stats, you can see there is a general fading trend that occurred. Even with the play-by-play, this could have been predicted since I’d stated the ending IF was 0.75 while the first 45 minutes was an inflated 0.89. It’s worth pointing out that any segment that had significant descending and thus didn’t allow constant pedaling resulted in a much lower IF. This is expected when you know how the data is compiled and calculated. This is a significant point and something most overlook when trying to execute pacing. Some sections will be executed higher (the more demanding points) while others will require little to no effort (the descents). So if you’re only pacing to the exact stat, say 0.75, and you attain this on the 1st climb and give yourself a pat on the back. But then you’re taken off when following the next descent, you note the IF drops below. This can result in possible underpacing early or even worse a stochastic effort trying to “chase” the number up. If I had to do it again maybe it would be worth putting Lap IF on a screen and only tracking segments versus the entire duration IF. But I was content pacing by my power band combined with the heart rate and RPE guardrails.
This data preceding data leads me to one of the biggest quarrels I wrestle with in coaching and racing; “use it when you have it” versus pace and finish strong. I usually opt for the former since edges athletes think exist can often be overcome with this tactic. But trust me it can go wrong which makes for long days when you misjudge.
I endured some serious points of suffering out there, but I think the real-time feedback confirmed I was still capable. Although it took some mental fortitude, I was still able to produce late efforts both the Carter summit paved climb well into my Zone 2 power and even into Zone 3 for the final 15 minutes. If I were empty, I wouldn’t have been able to muster even Zone 2 power. Trust me I’ve found that edge before!
Whew, that was a lot on IF and even a bit too heavy on stats than even I’d prefer. But I just had to observe and report back on it. Now I’d like to dive into the other part of how I executed the pacing; utilizing the “Trifecta” relationship of Heart Rate response, to Perceived Effort (RPE = Rating of Perceived Exertion), to Power.
This trinity is where I normally put more of my focus both in daily training and racing. I see each training session as an opportunity to learn more about yourself in the process and as a coach communicate better to athletes I coach daily. It’s tuning in, not tuning out!
What I’m seeing in real-time is a constant feedback loop that ultimately depends on how it all feels (RPE). That goes for when perception is easy or hard. As I alluded to earlier the initial climbs up St. Kevins felt easy, but I also had to use the data and respect how long I was going to be out there while taking into account any reasons that feeling may be lower. Cold temps, freshness, increased fueling, etc. It’s how I explain Endurance riding to athletes; what you can do for 60-90min may not extrapolate to hours on end. The fatigue component is real, especially when you’re fighting an expenditure rate that is challenging to offset with calorie intake.
I was happy to report a low RPE while seeing better-than-expected power to start. Much better than RPE being in the dumps, but that has happened too. When I raced the event I felt relatively flat until Pipeline inbound which was a bit bittersweet. On one hand, nice to feel good and finish strong, but also challenging to stay on the pace for 75 miles battling dullness.
Aside from IF, St. Kevins Gulch produced required an average of 251w (267NP) which was ~83% of my FTP. Within that was a 12-minute stint at 288w clearing the steepest initial pitch where my heart rate reached 157bpm, which is just below my sustainable race pace for hours or my LTHR.
This initial push above where I’d expect to settle in ultimately on the day was somewhat intentional for 2 reasons. 1) This section is often demanding enough that most must push a bit harder than they expect or like by default (even so in my case here), and 2) because the nature of the race usually presents the dynamic to put in a solid effort to establish yourself with a group of similar racers that can then race alongside one another. Unfortunately today, I didn’t have the latter as a support system. It was me versus the course!
I could easily focus on only the sections of output like the key climbs like other articles do, but I think it’s important how the end stats come together and how one can accomplish those demanding sections. It’s utilizing these seemingly unimportant “betweens” of the course that are often overlooked that makes the next section possible. A climbing course like this you can kind of think of like intervals. Push, recover, repeat!
Once I hit the pavement of Turquoise Lake Rd the intent was to bring my heart rate down and take on some fuel. The lowered cardiac output I’d hoped would allow easier food digestion with less competition between the gut and working muscles. Mission accomplished my Heart rate dropped from Tempo to 108bpm at its lowest and 130bpm average. It was short lasting only 6 minutes but enough to consume something out of my pocket and then prepare for the next “Sugarhagerloafin” sequence of climbs.
The next 3 climbs of increasing difficulty from paved to gravel to a rocky jeep road that summits under the Powerline at 11,100 ft presented an opportunity for a steady pace since it’s less punchy terrain than St. Kevins. This is seen in the smaller relative difference between my average and NP of 245w and 249w respectively. This is intentional if possible since a smoother effort also usually translates to a lower metabolic cost. Usually, punchy efforts can accumulate and leave you feeling empty later so smoothing the effort can aid in better performance over the long haul. The heart rate for this 32-minute section was 149 bpm on average (still mid-tempo for me) with a peak of 155 bpm (below my LTHR). I was still working within my execution parameters with the RPE seeming low for the output and like I could push a bit harder if desired. But I had to keep telling myself to hold back and let the course and effort come to me.
The theme of a longer work-to-rest ratio begins to repeat itself. Just like Turquoise Lake Rd only offered 6 minutes of recovery, Powerline offered 11 minutes although not complete rest since that includes a few significant kickers before being at the base. These kickers are worth noting because they can serve as those ROI points. A bit more effort can help you carry momentum farther up the other side and thus allow you to produce less overall effort. This is represented by my average power at a whopping 57w but with a peak of 599w. This was part of only a 23-second effort that was just above my FTP and very intentional as I slowed from 27mph to 13mph. But without this effort, I would have had to slow much more and grind a bit longer to get up and over the steep kicker in the middle of the descent. There was a second kicker that ascends to the final plunge down Powerline Proper that required a bit longer effort lasting just shy of 1 minute with a peak power of 490w and an average of 351w going from 33mph to 5.9mph. Even given these punches, I managed to drop my heart rate to 135bpm average with the lowest being 125bpm. I was hoping to take a bit longer of a rest and digest time on Powerline, but, unfortunately, or fortunately I’m a pretty OK descender and put it behind me quickly. I’m sure my nervous system would have preferred a bit longer too before the demands set back in, can’t lolligag!
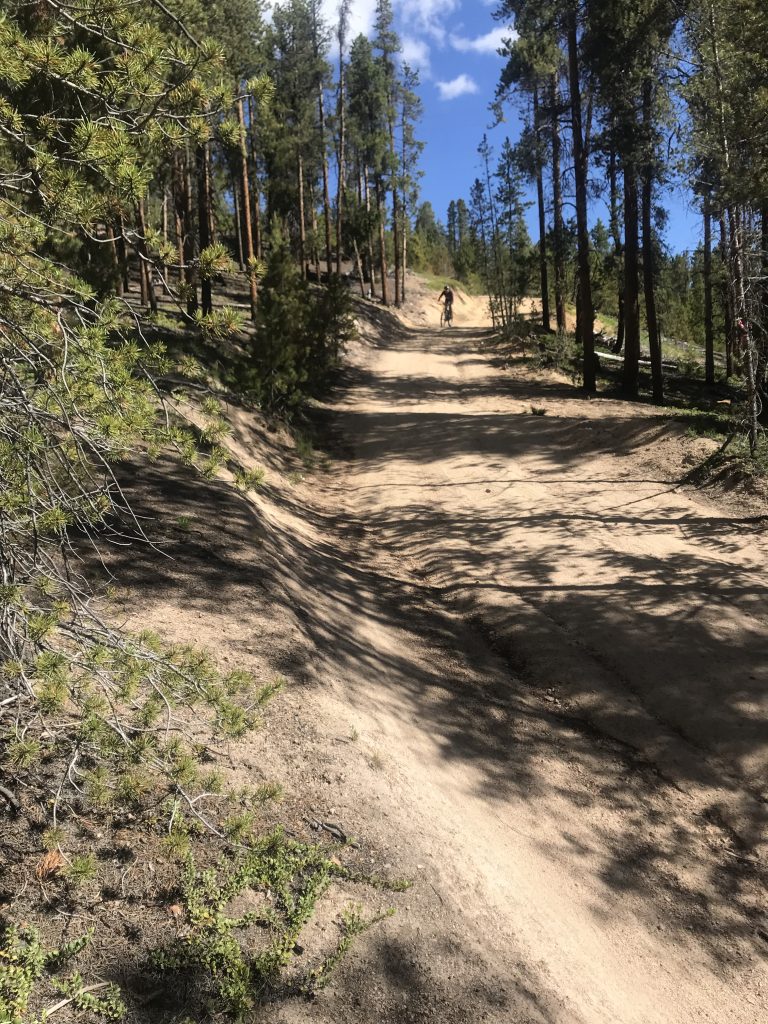 Once down Powerline and out into the Arkansas Headwaters Valley, I consider this the “revolutions” section. It’s all about turn-over and cadence from my perspective. The climbs naturally present a demand to produce power via torque (lower cadence) so the middle of the course is a spot to spin. I intentionally keep a bit of what I call “twinkle toes” with a higher cadence to hopefully unload the muscular tension that is inevitable with all the climbing. For brevity, the entirety of this section which I labeled “the pedaly middle” in the TrainingPeaks activity includes everything from the base of Powerline to the base of Columbine (or Lost Canyon Rd) and accounts for 1hour and 15min. If you want to see the splits that align with the timing and aid stations on race day, those details are segmented within in the activity too. During this, I averaged 201w and normalized 228w with the variance exhibiting the demands resulting from the undulating terrain and resultant power profile. My heart rate was 144bpm on average (just above Endurance/Z2) with a peak of 156bpm (just below my LTHR) all while my RPE was maintaining a 6-7 out of 10. I was intentionally “floating” my effort and HR over the bumps and valleys, the same as I executed on the kickers of the Powerline descent, to maintain momentum where I could while limiting taking my effort too high for too long. This is the recurring theme where it could be executed because it was about to change on Columbine!
The Columbine Mine climb is a point where the opportunity to float the effort goes out the window. There are no subsequent downhills or reliefs to compensate for a preceding dig. This is where true pacing and effort management smack you in the face. It goes from float to bear the inevitable drift and please I hope you don’t hit the base already near redline! And to add insult to injury is the increasing result of altitude gaining 3183 ft throughout 7.56 miles going from the “low” point of 9200 ft to the high point of the course at 12,440 ft. As you gain this elevation the relationship isn’t a linear loss in power. Research reports on average that most are already operating at 84-88% of full sea level capacity at altitudes representative of the base and then are further affected to 72-81% above 12,000 ft (depending on acclimatized vs non-acclimatized) (1) (2). This may be where the 0.70 IF is a valuable pacing tool because 70% of my FTP being ~210w is just below what I averaged for this section.
Over the 1 hour 15 minutes required to reach the Columbine summit, I averaged 229w (235NP) with a resultant heart rate average of 152bpm and a 160bpm peak (right at my LTHR). Averages can be misleading I encourage you to look at the heart trend in the activity. I’d hoped to start the climb with a bit lower absolute heart rate thus allowing more room to drift upwards, but unfortunately, the day was warming up and the direct sun was adding to the stress my body was experiencing. Ironically my device reported the highest temperature of the day at the top of Columbine as the device recorded a 20-degree swing from 60 degrees F to 80 degrees F when I was above treeline, going slowest, and in the direct sun. This is the point in the course where my RPE was matching what my heart rate was reporting and my power was beginning to report at or below what my RPE was telling me. My heart rate stayed pretty steady right around 150 bpm and then any steeper section or switchback I allowed it to drift a few bpm higher.
I didn’t want to be riding right at my redline knowing that I intended to try to clean the entire climb which is VERY demanding in the final 1.8 miles past A-frame. I was intentionally allowing a cushion so I had just a bit of extra “grunt” to clean some steep pitches without going into the red. Also, I know I’m only halfway at this point with the entire inbound awaiting. That seems daunting to even type! My RPE potentiated on this climb, as expected with all the variables compounding against you. Increasing altitude, limited reliefs, accumulated fatigue, heat stress, energy depletion, and hydration depletion are all mounting!
I managed to clean the entire climb but not without burning some matches. As I explained in the previous article it required hitting a peak power of 590w above 12,000 ft and getting my cadence very low into the 46rpm average nearing 5 minutes. That is some severe muscle tension and torque and why I intentionally try to spin in the middle of the course.
Once the climb is over I was briefly rewarded with a 17-minute descent. This wears on you more than you would expect since you still must eccentrically support your body soaking up the bumps and accelerating out of those switchbacks that were just ticked off on the way up. Either way, it’s a welcome relief to not pedal at this point. But soaking up the bumps descending while not pedaling is eccentrically taxing in its own way so I intentionally try to pedal some when opportunities present themselves so I don’t get to the base with complete Lincoln Log dead legs. I also take this opportunity to stretch my lower back in the hip hinge position, relax the upper body, and even stretch my quads and calves. The stats for this section is an average power of 39w (even with a peak of 452w produced coming out of a switchback getting back up to speed) but all the while still allowing my heart rate to drop to 101bpm at its lowest and 125bpm average (which is my base Endurance pace). This was a welcome relief to my cardiovascular system yet again which had just endured a very demanding ask of its cardiac output on the day not to mention being over 4 hours in at this point.
Now inbound on the “the pedaly middle” once again, it’s a repeat of the outbound portion. I’m a bit slower inbound at 1 hour 26 minutes. The power stats reinforce this drop in pace with an average power of 192w (208NP) while the physiological response was nearly identical with an average heart rate of 143 bpm and peak HR of 153bpm. Lower power for the same cardiac response isn’t what you want to see but sometimes inevitable. Where the trifecta begins to detach is my RPE. As I’d noted on Columbine, the RPE was aligning if not becoming challenging for the output and resultant HR I was seeing. Now facing a headwind, some sandy climbs, and all the accumulating fatigue from Columbine… well all of the course for that matter; I hit my low point for the day. I had to motivate myself by setting a power floor to drop below here. It kept me honest and on the pace. I sooooo wanted to just coast any slight downhill or let off the pressure I was exerting into the pedals but that instantly resulted in Zone 1 watts. But I didn’t allow myself to sink there knowing that it would result in losing valuable momentum and ultimately valuable mph!
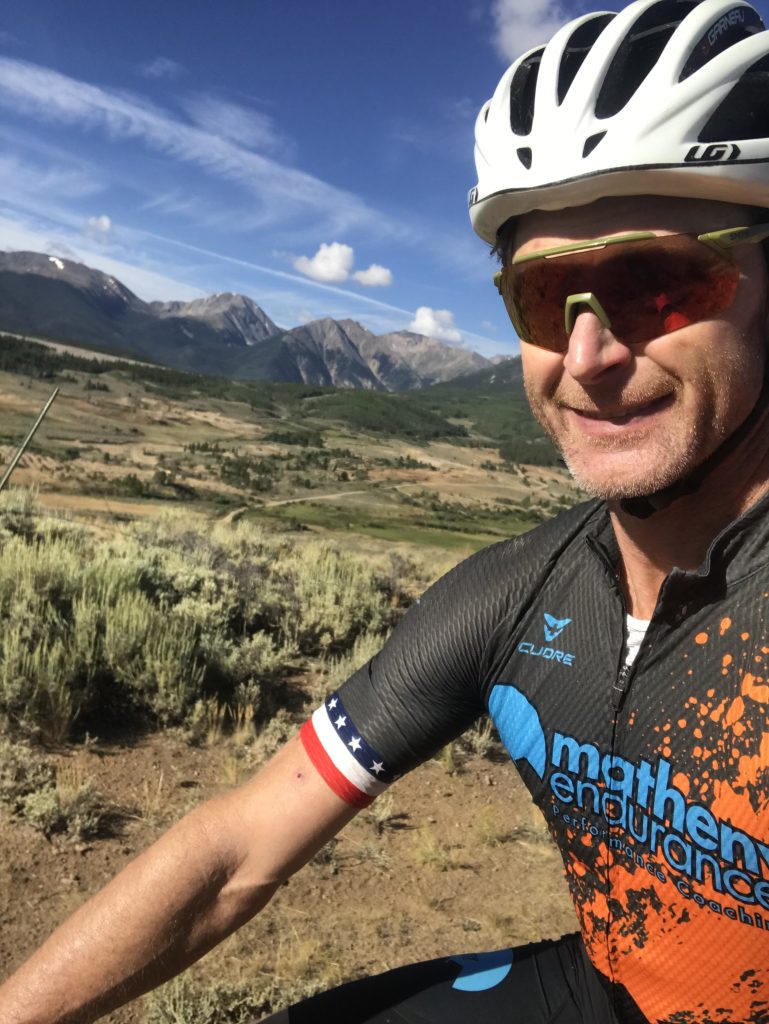
Faking a smile through the Grit!
I battled the physical and mental demons through Pipeline draining all my fluids and restocking at my make-shift stashed aid station just after Pipeline aid. This was a much-needed but quick stop lasting only 75 seconds. I was both literally and figuratively running pretty low since it had been just shy of 4 hours since I’d stopped here outbound. Being the last time I’d be able to restock, I used this stop as a chance to chug a bottle of water to dilute my sour gut that wasn’t quite agreeing with all the fuel I was giving it and then taking on the remainder of bottles and snacks that I’d planned to deliver me to 7th St in Leadville hopefully only a couple hours later.
The next challenge was Powerline and not just the first pitch but the entirety. So many only see it as that first infamous wall that stares you down, but in all reality that is a relatively short section of the entirety. This section lasted 40 minutes for me with an average power of 219w (230NP) with a peak of 437w! Again cleaning the initial steep pitches was super demanding and again required my lowest cadence of the day down to 30 rpms for minutes sustaining just below my FTP around 275w. This resulted in a pretty high RPE and heart rate at times but the difference from Columbine was the subsequent rests that allowed the effort level to drop and the load to be removed from the muscles. My heart rate average was 147bpm and a peak of 159bpm (again Tempo average but LTHR peak) which signifies floating the effort again but not keeping it right on redline and if so, only for short periods.
The “Sugarhagerloafin” segments inbound are a bit different. Now in reverse, it’s all descending, but not easy. The top Sugarloaf descent is only 4 minutes and can be quite demanding due to the embedded baby-head rock reinforcing line choice to avoid a flat or crash. I still managed to let my HR drop to 122 bpm during these short minutes. A quick turn onto Hagerman pass with a shallow grade of -2.7% necessitates pedaling. Those 5 minutes were at an intentionally lower Endurance output of 150w as I felt any more effort to increase speed only slightly was costly. The paved descent on Turquoise Lake Road was again very short lasting 1 short minute, but welcomed since required no pedaling and my HR dropped to 107bpm. Ahhhh!
This was important to me as the next paved climb back up Turquoise Lake Rd is always challenging for me for some reason. Whether in previous races, camps, or training rides; today was no different. I’ll blame it on my riding strengths and riding style of anaerobic punch and then recover that suits me. This section, like Columbine, doesn’t appeal to this riding style so I was forced to again set a carrot as my floor and keep reminding myself to “spin up” to maintain that. For the 24 minutes of pavement required to reach Carter Summit, my RPE was that of threshold or an 8 of 10, all the while my average power was purely an Endurance number at 208w (213 NP) and my heart rate was in the low Tempo range at 143bpm and a peak of 148bpm. Seeing that detachment with higher RPE and HR for lower absolute outputs wasn’t encouraging, but I thought optimistically to myself “More miles lay behind me than in front of me now!”
I saw this detachment trend slowly engulfing me like the Grim Reaper’s scythe since Columbine inbound. I expected it, but something important to highlight here is the HR suppression with an increasing detachment of the trifecta. The heart rate begins to no longer respond to increases in output while the RPE climbs. I call this your physiology sending you signs to slow down! It’s saying, “I’m tired, can you stop this already?” It’s had enough and precedes throwing in the towel completely. I’m honestly glad it didn’t happen earlier in the day but also know I’m not home yet with the Boulevard climb into Leadville still awaiting after descending St. Kevins Gulch.
St. Kevins isn’t all descending but it’s the type of riding I prefer with intermittent descents and efforts while also navigating some singletrack and momentum. It only lasted 13 minutes, but was a lower overall output with a 124w average (193NP). This variance shows some punchiness and is apparent with again a peak power of 441w including a 2-minute stint at Tempo of 246w. Even with a few mini-summits requiring these punches my heart rate average was 133bpm and peaked out at 151bpm. Here is an example of where my favored anaerobic capacity forced a higher peak cardiac response than the previous steady effort on Turquoise Lake Rd.
Now being at the base back at the Arkansas Headwaters in the valley once again I’m left to spin the flats on the paved road and dirt along the RR tracks before facing one last grind to completion. The valley lasts 13 minutes and again like Hagerman Pass, I maintain a lower Endurance pace knowing that the Boulevard climb will be a heightened necessity. I don’t want to be too empty when I get to that point. This results in a 155w (172NP) output corresponding to a 134bpm average and 142bpm peak heart rate. Now experiencing both HR and power suppression, the RPE was higher than both of these stats represent. The check engine light is fully illuminated now with 2 of the 3 metrics detached.
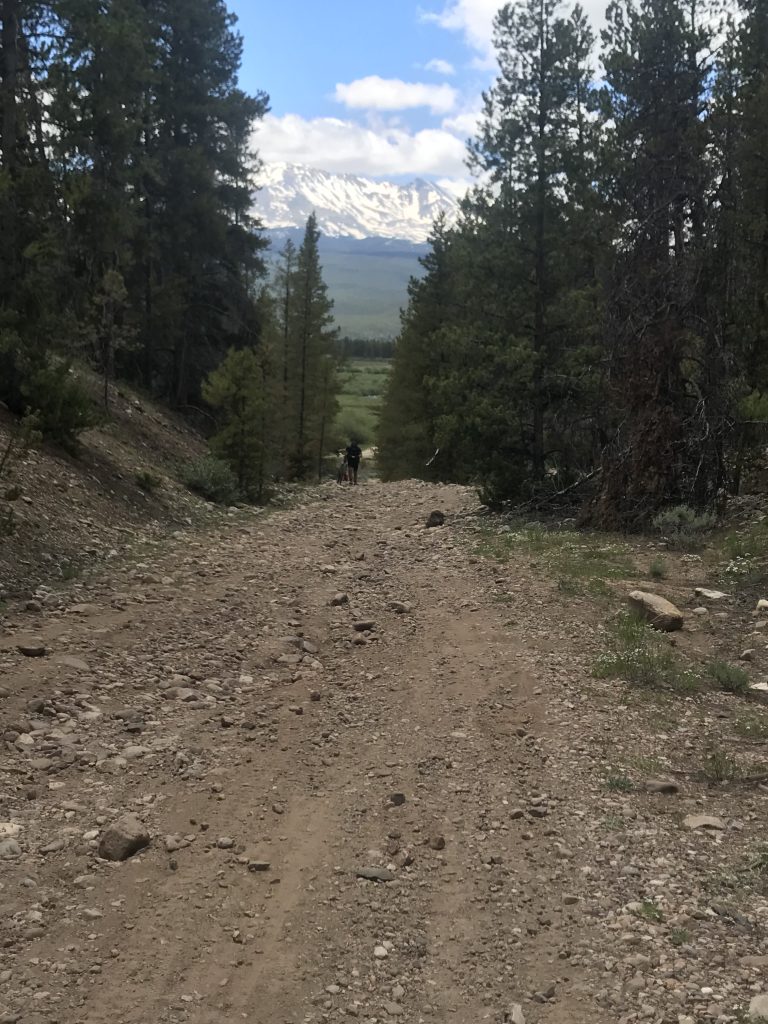
The Boulevard in all it’s glory!
But I can’t stop and won’t stop, as I turn onto the demoralizing rocky and rough start to the Boulevard. Just keeping traction and picking a line that doesn’t roll a rock out from under your tire is the challenge here. I manage to keep traction and power on repeating to myself the finish is near and setting that power carrot a bit higher now attempting to “Tempo” the last climb. At any point I lost focus the power would drop, so I had to constantly force my focus to “pressure on the pedals”. It worked as the final 15 minutes resulted in a steady 230w average (236NP) with a heart rate response of 147bpm average and 154bpm peak. The RPE for this session was solid “all I could muster”. That’s a technical term and one you’ll find on Borg’s RPE scale! It wasn’t exactly a 9 or 10 of 10, but I just didn’t have the physical capacity to push my body to elicit that feeling. Everything was suffering and my body was creating its buffer via suppression.
But even those stats prove that at least I was emptying the tank, but wasn’t empty because I was able to edge both the power output up as well as the resultant heart rate response. adn then still over the last paved climb on 7th St by the high school I was able to muster a 277w effort and push my HR up near my low LT meaning I had at least some fumes left. I’m just glad I wasn’t racing because by no means would I have had anything left if it was coming down to a sprint. But that happened and I answered at Marathon Nationals this year for a medal so maybe I’ll write on that.
Anyway, I was happy to come away with a time of 7:58:07 as I lapped the device by the Lifetime crews setting up fencing and the finish line truss for the next day’s dance. On the day, I was proud of the stats I posted at the beginning of this article and coming in sub 8. Don’t get me wrong, somewhere deep down I wanted to get closer…much closer to my previous best of 7:23, but that was a decade younger, before marriage, with 2 fewer kids, and before starting Matheny Endurance. Lots has changed and this was a respectable effort where I learned a lot about myself, but more so hopefully gain some insights that you benefited from here as well that will benefit clients I coach.
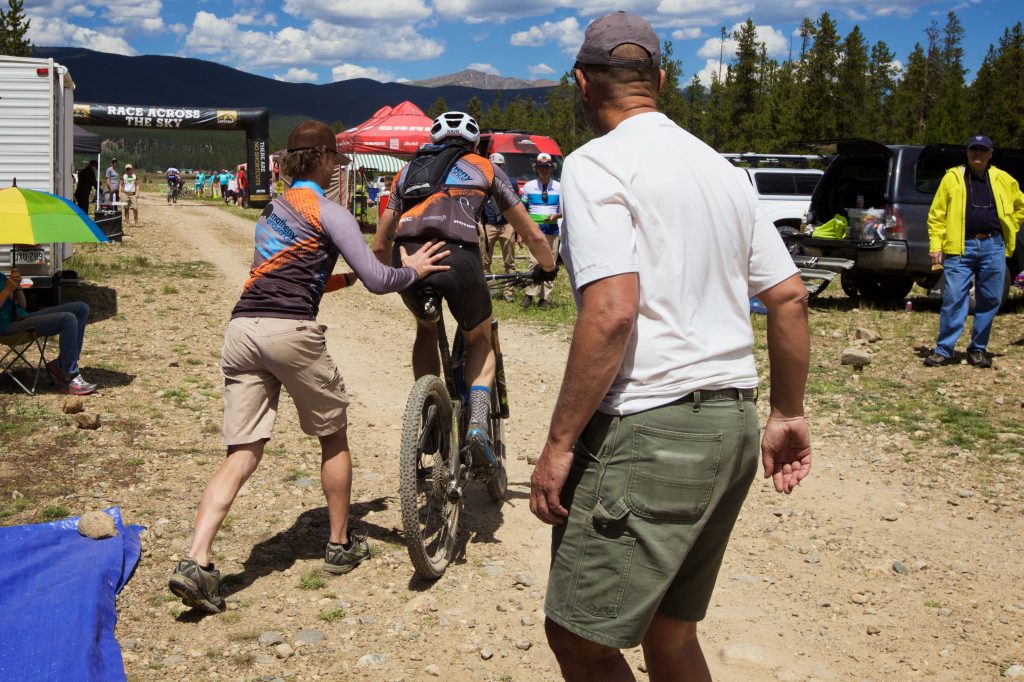
There wasn’t much time to bask in the completion that day; it was pretty much straight to pounding some fluids to clear out my gut and getting some non-sugary food so I’d be able to perform my duties as coach and support. I wouldn’t have it any other way though as now the ride was behind me. I could feel good about knowing I’d accomplished it and on to collecting aid bags, athlete dinners, and getting some much-needed sleep before standing in the pits for a full day of support the next day.
If you enjoyed this content please leave a comment, share with a friend, or follow along on Instagram so you will be notified of more valuable coaching and training insights. If you found it valuable then please consider scheduling a consultation or donating Venmo @mathenyd or Paypal @Matheny. See you out there in the trenches!
References
(1) Bassett, D.R. et al. (1999, November). Comparing cycling world hour records, 1967-1996: modeling with empirical data. Retrieved from https://pubmed.ncbi.nlm.nih.gov/10589872/
(2) Péronnet, F. et al. (1991, January). A theoretical analysis of the effect of altitude on running performance. Retrieved from https://pubmed.ncbi.nlm.nih.gov/2010398/